6. Transit Accessibility of all locations in the Region
This section explains the Transit accessibility → Region maps calculations(Figure 1).
Figure 1. Transit accessibility → Region maps menu
We present in detail the From every location – Fixed-time departure and then the differences for each of the three other options. These computations demand
Transit routing database, see Construct Databases → Transit routing database.
The layer of buildings. This layer must be a part of the current QGIS project.
6.1. Transit accessibility from every location in the region, fixed-time departure
Choose From every location – fixed-time departure (Figure 2).
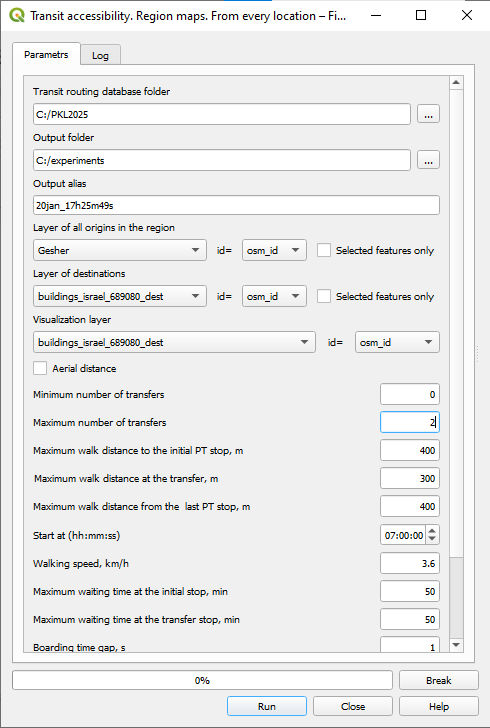
Figure 2: Region maps From every location – fixed-time departure dialog
Transit routing database folder — the folder of the transit routing database. Must contain the following files: stops.pkl, stoptimes.pkl, transfers_dict.pkl, idx_by_route_stop.pkl, routes_by_stop.pkl
Output folder — the folder for storing the results of the computation. The system’s suggestion is a subfolder in the folder where the QGIS project is stored with the name that is a concatenation of the name of a project and “_output.”
Output alias — the alias for the files of results.
Layer of all origins in the region — the layer of the region buildings, may be selection set (if checked). The layer must be a part of the current QGIS project.
id — the unique identifier of a building in a layer of origin buildings.
Layer of destinations — the layer of the destination buildings, may be selected set (if checked). The layer must be a part of the current QGIS project.
id — the unique identifier of a building in the layer of destination buildings.
Note
In the case of region accessibility, the layers of origins and destination are often the same; the user must be very careful not to confuse them in case they are different.
Visualization layer — the layer that will be used for visualization of accessibility maps, must be a part of the current QGIS project.
id — the field of the unique identifier of the visualization layer feature, must be the subset of the origin buildings’ identifiers.More information here.
Minimum number of transfers — the minimum number of transfers of the transit trip, typically 0.
Maximum number of transfers — the maximum number of transfers of the trip, may be 0, 1, or 2.
Maximum walk distance to the initial PT stop, m — the maximum acceptable walking distance between the trip origin and the first bus stop. The default value is 400 m.
Maximum walk distance at transfer, m — the maximum acceptable walking distance between two stops at the transfer. The default value is 150 m.
Maximum walk distance from the last PT stop, m — the maximum acceptable walking distance between the last stop of a trip and destination. The default value is 400 m.
Start at (hh:mm:ss) — trip start time.
Walking speed (km/h) — walking speed.
Maximum waiting time at the initial stop, min — the maximum waiting time at the initial stop of the trip.
Maximum waiting time at the transfer stop, min — the maximum waiting time at the transfer stop.
Maximum travel time, min — the maximum total travel time.
Number of bins — the number of bins for splitting the possible trip time interval, [0, Maximum travel time]. The region buildings’ accessibility measures will be stored by the time bins. The Number of bins must not exceed the Maximum travel time.
The bin width is calculated as the Maximum travel time/Number of bins.
If the last bin does not match the Maximum travel time, the buildings’ accessibility measures for the Maximum travel time are also stored.
Typically, the Number of bins is selected in a way to have the bin’s width of 5 or 10 minutes, while a 2- or even 1-minute bin can be useful for further analysis of accessibility.
Choose building characteristics for accessibility assessment — The total number of buildings accessible from each building of the region is a default measure and is always calculated. In addition, each of the building’s numeric attributes can be selected for accessibility assessment. For example, if the number of jobs is known for a building, then the accessibility to jobs that can be reached from a building can be assessed. You could choose several characteristics for this assessment (Figure 3).
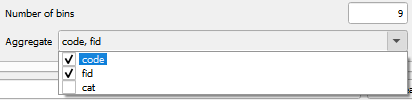
Figure 3. The choice of attributes for the region accessibility assessment
The sum of the attribute values over buildings achievable during the time of one, two, etc., bins will be stored as a separate file for each of the chosen attributes in the Output folder, and accessibility to each of the attributes is presented by the thematic map. In case the computations are based on the selection of buildings, the results will include the new layer that represents the selected buildings of the trip origin. The structure of the result files is described in the next section. Click Run to start. The Progress bar shows the progress of the computations. You can break the process of the computations by pressing Break. The Log tab contains the parameters of the run and run’s metadata and is explained in the next section.
6.1.1. The log file and Region accessibility report
The log file (Figure 4) is stored in the folder of the results. It lists all the settings of the run and the computation time.
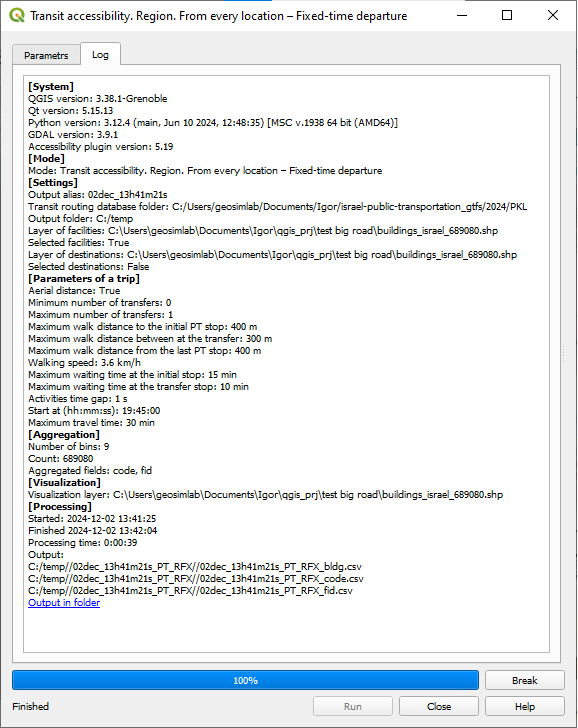
Figure 4. The log file of the Region map From every location – fixed-time departure computations
The default CSV output file presents the total number of buildings that can be reached from each of the region’s buildings after every time bin. Figure 5 presents this file for the case of the from-accessibility:
| Attribute | Meaning |
|---|---|
| Origin_ID | The ID of the building of origin |
| Time bin 1 | Total number of buildings accessible in 1 time-bin |
| Time bin 2 | Total number of buildings accessible in 2 time bins or faster |
| …Time bin N | Total number of buildings accessible in N time bins or faster |
| Maximum travel time (if not a multiple of a time bin) | Total number of buildings accessible in maximum travel time |
Figure 5. The structure of the default result table for the Region maps → From every location – fixed-time departure
The corresponding thematic map presents the number of buildings reachable in maximum travel time. Additional result tables present the totals of other attributes chosen for accessibility assessment and for each of them the thematic map of the result for the maximum travel time is constructed. The example of the Region maps → From every location – fixed-time departure computations here.
6.2. Transit accessibility to every location in the region, fixed-time arrival
To compute the to-accessibility of every location in the region run the To every location – fixed-time arrival. Most of the parameters of the region’s transit to-accessibility computations are the same as for the from-accessibility. The only difference is in establishing origins and destinations, which, in the case of regional accessibility are often the same, and the user must be very careful not to confuse between them. The Log and Result files are the same as for the from-accessibility, with minor differences that reflect the from-accessibility to the to-accessibility changes. The example of the Transit accessibility → Region maps → From all locations – fixed-time departure computations see here.
6.3. Region accessibility for the schedule-based departure or arrival
The reasons for introducing and the basic idea of the schedule-based view of accessibility are presented in Section 5.5. The examples of schedule-based accessibility are here and the comparison between the time-fixed and schedule-dependent region accessibility is here.